




KEY TAKEAWAYS
- Equity markets were flat to slightly lower in the third quarter but remained positive year to date, supported by strong corporate earnings and broader market participation.
- Bond prices declined as inflation concerns, elevated government spending, heavy Treasury issuance, and geopolitical uncertainty contributed to interest rates rising higher.
- The U.S. economy showed resilience, with an upward revision to second-quarter growth and expanding manufacturing and services activity.
- Market volatility could persist amid geopolitical uncertainty, oil-price pressures, and the upcoming midterm election cycle.
1. Equity Markets Flat: Bond Markets Decline
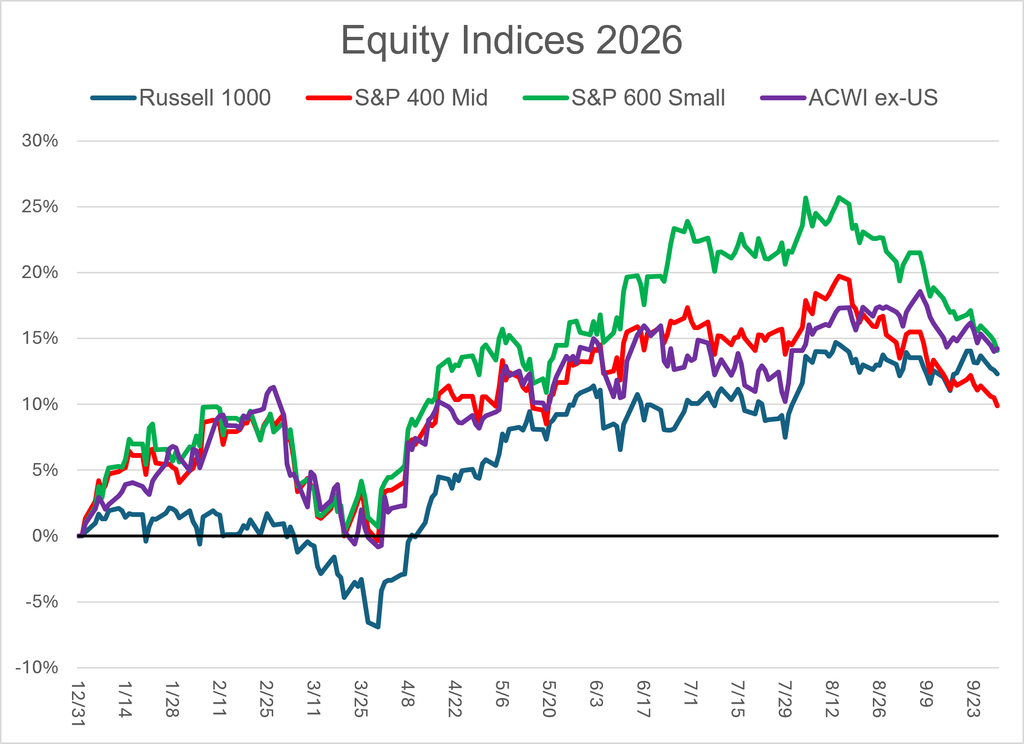
During the third quarter of 2026, markets extended their rally through the month of July, but concerns increased in August and September. The net result is that equity markets were flat to slightly down for the quarter. However, as of September 30th, broad equity indices have shown growth while bond markets have declined due to rising interest rates.
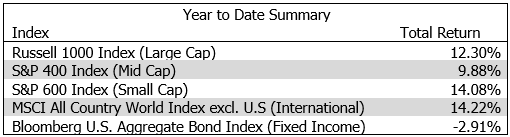
Index performance presented for illustrative and informational purposes only. Indices unmanaged, do not reflect fees, expenses, or transaction costs, and are not available for direct investment.
2. Iran War Adds to Oil Price Pressures
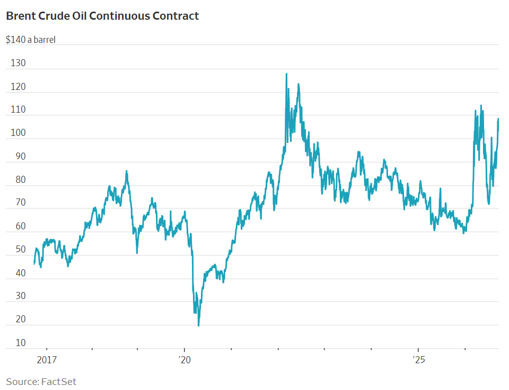
Geopolitical and economic factors have increased market volatility. The Iran war, begun at the end of February, contributed to a sharp rise in oil prices. A mid-year U.S.–Iran understanding temporarily reduced fears of a prolonged closure of the Strait of Hormuz, but renewed hostilities later in the summer revived supply concerns. Restricted oil flows, rising Red Sea risks, and intermittent military escalation kept crude prices and inflation expectations volatile. The double spike on the far right of the chart reflects the initial jump in oil, followed by some relief with a cease-fire, then a resumption of higher prices in the final weeks of September. The situation remains uncertain, with no clear resolution in sight.
3. Inflation Remains Above Target
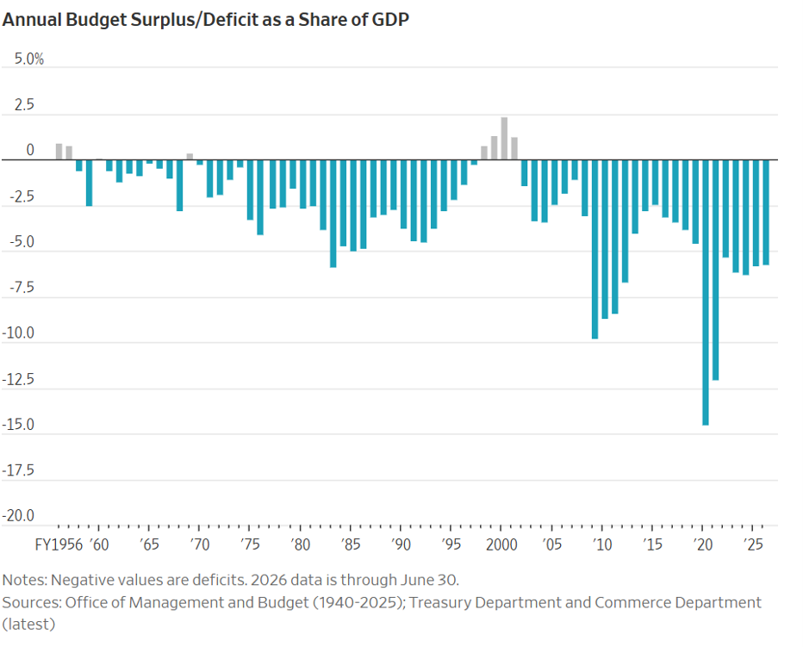
On the economic front, persistent inflation combined with elevated government spending has pushed bond yields higher. Rising U.S. debt and deficits, plans for increased defense spending, and heavy bond issuance contributed to a sell-off in long-dated government debt. The corresponding chart shows how government spending remains elevated well after COVID-related measures drove it higher in 2020 and 2021.
With the assumption that budget deficits will continue, bond investors have begun the demand more compensation to lend the U.S. government money. Persistent, elevated inflation has forced the Federal Reserve to respond by raising the Fed Funds rate by a quarter of a percent at its September meeting. The hope is that this tightening will be enough to push down inflation. August Core Personal Consumption Expenditures (a primary inflation metric that the Fed follows) came in at 3%, below economists’ forecast of 3.3%1. Yet, the level of inflation remains well above the long-term 2% target.
These factors have contributed to weaker bond performance.
4. Bond Prices Fall
By the end of September, the 10-year Treasury yield was at approximately 5.3% – a multi-decade high. This upward move in bond yields has had a negative impact on bond prices. The Bloomberg U.S. Aggregate Bond Index is a flagship benchmark that stands as a proxy for much of the bond market. Through September, the index is down -2.91% year to date. The trailing 12-month yield on this index is approximately 4.1%, which is roughly the interest return from the bonds in the index. Because the total return is -2.91%, that implies that bond prices have fallen more than the income being generated from the bonds, largely reflecting the rapid rise in interest rates.
5. Economy Shows Signs of Strength
Not all the factors pushing bond yields higher are signs of economic stress. For example, the U.S. economy has performed well and is showing signs of strengthening. The Bureau of Economic Analysis revised its estimate for second quarter growth was revised up from 1.5% growth to 2.2% growth, which is a meaningful upward revision.2 In addition, the latest U.S. Purchasing Managers Index for September showed accelerated growth in both manufacturing and services at a composite level of 58.4.3 The Purchasing Managers Index is a survey measure that examines the activity level of supply chain managers. Readings above 50 indicate expansion; readings below 50 indicate contraction. The strong U.S. economy is another factor pushing bond yields up. Low yields can imply low economic growth, so it follows that a growing economy could be associated with higher yields.
6. Corporate Earnings, AI Boost Equity Markets
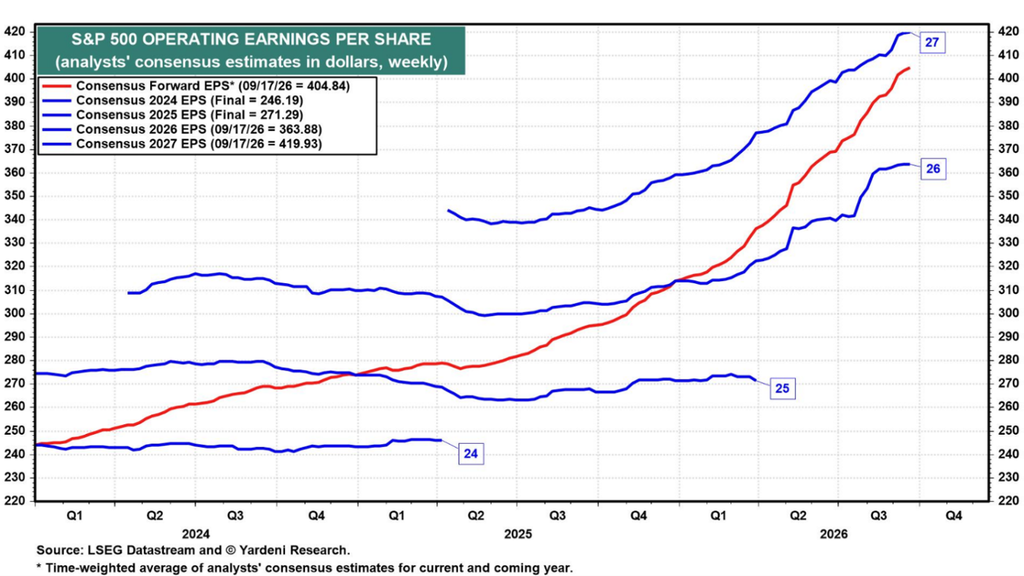
That economic strength has also provided an important foundation for corporate earnings and equity markets. Unusually strong corporate earnings results and sustained investment in artificial intelligence infrastructure supported the Equity markets. The chart shows the level of operating earnings per share for the entire S&P 500 by year in blue. The first thing to note is that each successive year has been a step up from the previous year, indicating growth. For 2026, the level represents a consensus estimate among Wall Street analysts for year end. Notice that this estimate continues to be revised upward, implying continued strength in 2026. Estimates for 2027 also indicate growth. The red line shows the estimate for the next 12 months. The fact that it curves upward implies growth at an increasing rate. Strength in earnings can be supportive of stock prices, although it does not guarantee that stock prices will move up.
The rally broadened beyond the largest U.S. technology companies to include other domestic large caps, mid-caps, small caps, and international stocks. In summary, equity returns have been strong through the first nine months of the year. Over the same period, equity markets showed an early slide in March as the Iran War began, then recovery through the summer months as earnings growth became more apparent. Finally, a consolidation occurred from late August to the end of September as bond yields increased.
Closing Thoughts
Looking ahead, investors have another potential source of volatility to consider: the mid-term elections, which tend to generate more market volatility than non-election years.4 Even more interesting is that stocks typically rise after the election, but not every time. The general idea is that volatility and uncertainty are higher before the election because the results are unknown. Once the results are official, uncertainty declines along with volatility. Of course, these studies are backward looking and are not necessarily predictive of future returns.
- https://www.cnbc.com/2026/09/30/feds-preferred-gauge-showed-core-inflation-at-3point0percent-in-august-much-lighter-than-expected.html ↩︎
- https://www.bea.gov/news/2026/gdp-third-estimate-industries-corporate-profits-state-gdp-and-state-personal-income-2nd ↩︎
- https://tradingeconomics.com/united-states/composite-pmi ↩︎
- https://www.fidelity.com/learning-center/trading-investing/the-surprising-truth-about-midterms-and-stocks ↩︎
Disclaimers:
This material is provided by Councilor Wealth, LLC for informational and educational purposes only. It is not intended as, and should not be construed as, individualized investment, tax, legal, or accounting advice or as a recommendation to buy, sell, or hold any security. Statements concerning market or economic conditions reflect information and views available as of September 30, 2026 and are subject to change without notice. Forward-looking statements, forecasts, consensus estimates, and market expectations are inherently uncertain and may not be realized. Past performance does not guarantee future results. All investments involve risk, including possible loss of principal. Market indices are unmanaged, may have characteristics materially different from a client portfolio, and are not available for direct investment. Index returns do not reflect advisory fees, transaction costs, taxes, or other expenses that would reduce investor returns.
Provision of services:
Investment advisory services are provided by Councilor Wealth, LLC, an SEC-registered investment adviser. Registration does not imply a particular level of skill or training. Tax and accounting services offered by the affiliated entity Councilor, Buchanan & Mitchell, PC, under separate regulatory frameworks. Information provided by Councilor Wealth is not intended as tax advice. Readers should consult appropriate professional advisers regarding their individual circumstances.
Indexes Mentioned:
The Bloomberg Aggregate Bond Index is a comprehensive benchmark for the U.S. investment-grade bond market, reflecting over $50 trillion in securities. The Purchasing Managers’ Index (PMI) is an economic indicator that assesses the business environment by surveying purchasing managers at private-sector companies about their expectations for orders, production, employment, and supplier deliveries. The Russell 1000 Index is a U.S. stock market index that tracks the largest 1,000 stocks in the Russell 3000 Index. The MSCI ACWI ex USA Index is a global equity benchmark that tracks large and mid-cap stocks across 22 developed markets (excluding the US) and 24 emerging markets. The S&P MidCap 400 provides investors with a benchmark for mid-sized companies. designed to measure the performance of 400 mid-sized companies. The S&P SmallCap 600 is a benchmark index measuring the U.S. small-cap equity market, tracking approximately 600 domestically oriented companies.